Introduction: Overview of Python for Data Analysis
Python is one of the most popular programming languages used for data analysis, machine learning, and artificial intelligence. It is a versatile language that is easy to learn and has a vast library of packages that cater to various data analysis needs. Python’s popularity in data analysis is due to its simplicity, readability, and flexibility.
Python is an open-source language that is widely used in scientific computing, data analysis, and data visualization. It has a wide range of packages that makes it easy to manipulate, analyze, and visualize data. Some of the popular data analysis packages in Python include NumPy, Pandas, Matplotlib, and Seaborn. These packages provide a wide range of functionalities like data manipulation, data visualization, and statistical analysis.
Python can be used for various types of data analysis, including exploratory data analysis, statistical analysis, and machine learning. It is also widely used in business analytics, financial modeling, and market research. Python’s popularity in data analysis is due to its simplicity, readability, and flexibility.
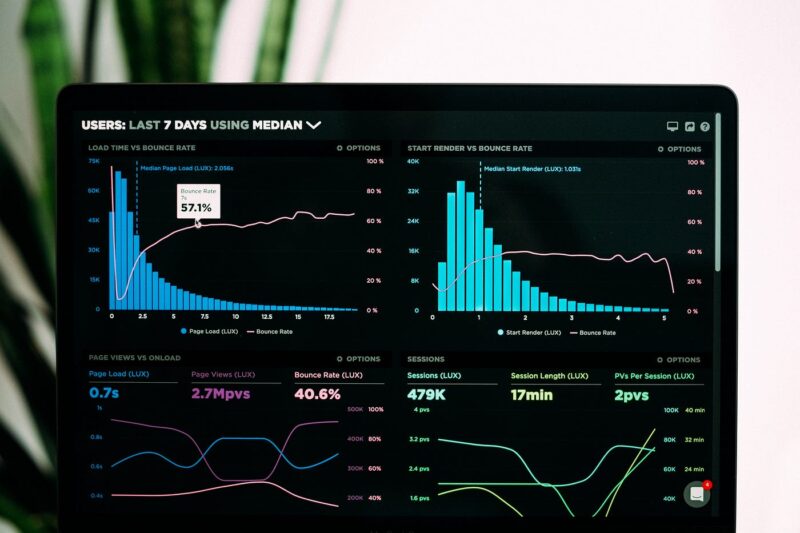
Python is also widely used in generating reports, dashboards, and presentations. Its ability to integrate with other tools and platforms makes it a popular choice for generating reports. Python’s data visualization packages like Matplotlib and Seaborn can be used to generate interactive and informative reports.
In the next sections of this article, we will look at the techniques for gathering data, steps for analyzing data with Python, tools for creating reports with Python, and the benefits of using Python for data analysis and reporting.
Data Collection: Techniques for Gathering Data
Data collection is the first step in data analysis, and it involves gathering data from various sources. In this section, we will look at some techniques for collecting data using Python.
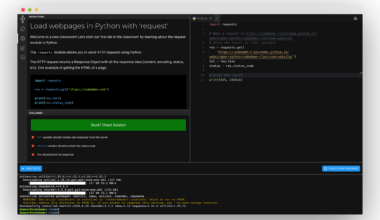
1. Web Scraping: Web scraping involves extracting data from websites. Python has several packages like Beautiful Soup, Scrapy, and Requests that can be used for web scraping. Beautiful Soup is a Python package that can be used for parsing HTML and XML documents. Scrapy is a web crawling framework that can be used for large-scale web scraping projects. Requests is a Python library that can be used for making HTTP requests and retrieving data.
2. APIs: APIs or Application Programming Interfaces are used to access data from websites. Many websites provide APIs that allow developers to access their data. Python has several packages like Requests, Tweepy, and PyGithub that can be used for accessing APIs. Tweepy is a Python package that can be used for accessing Twitter data. PyGithub is a Python package that can be used for accessing Github data.
3. Databases: Databases are used to store and manage large amounts of data. Python has several packages like SQLAlchemy, Psycopg2, and PyMySQL that can be used for working with databases. SQLAlchemy is a Python package that can be used for working with SQL databases. Psycopg2 is a Python package that can be used for working with PostgreSQL databases. PyMySQL is a Python package that can be used for working with MySQL databases.
4. CSV Files: CSV or Comma Separated Values files are used to store data in tabular form. Python has a built-in CSV module that can be used for reading and writing CSV files. The CSV module provides several functions like reader(), writer(), and DictReader() that can be used for working with CSV files.
In conclusion, Python provides several techniques for gathering data from various sources. Web scraping, APIs, databases, and CSV files are some of the popular techniques for collecting data using Python. Python’s versatility and vast library of packages make it a popular choice for data analysis and reporting.
Data Analysis: Steps for Analyzing Data with Python
Once you have gathered data, the next step is to analyze it. In this section, we will look at the steps for analyzing data using Python.
1. Data Cleaning: The first step in data analysis is data cleaning. This involves removing any duplicate or irrelevant data, dealing with missing data, and formatting the data. Python’s Pandas package provides several functions like drop_duplicates(), dropna(), and fillna() that can be used for data cleaning.
2. Data Exploration: After cleaning the data, the next step is data exploration. This involves understanding the data, identifying patterns and relationships, and visualizing the data. Python’s Matplotlib and Seaborn packages provide several functions like scatterplot(), lineplot(), and heatmap() that can be used for data exploration.
3. Data Transformation: Once you have explored the data, the next step is data transformation. This involves transforming the data into a format that can be used for analysis. Python’s Pandas package provides several functions like groupby(), pivot_table(), and merge() that can be used for data transformation.
4. Data Analysis: After transforming the data, the next step is data analysis. This involves applying statistical techniques to the data to identify trends and patterns. Python’s NumPy and SciPy packages provide several functions like mean(), median(), and correlation() that can be used for data analysis.
5. Data Visualization: Once you have analyzed the data, the final step is data visualization. This involves presenting the data in a visually appealing and informative way. Python’s Matplotlib and Seaborn packages provide several functions like barplot(), boxplot(), and piechart() that can be used for data visualization.
In conclusion, Python provides several steps for analyzing data, including data cleaning, exploration, transformation, analysis, and visualization. Python’s vast library of packages makes it easy to manipulate, analyze, and visualize data. By following these steps, you can gain valuable insights from your data and make informed decisions.
Report Generation: Tools for Creating Reports with Python
Python is not only a powerful tool for collecting and analyzing data, but it is also a great tool for generating reports. In this section, we will look at some of the tools that can be used for creating reports with Python.
1. Jupyter Notebook: Jupyter Notebook is an open-source web application that allows you to create and share documents that contain live code, equations, visualizations, and narrative text. It supports over 40 programming languages, including Python. Jupyter Notebook is a great tool for generating reports as it allows you to combine code, images, and text in a single document. You can also export Jupyter Notebook documents as PDFs, HTML files, or slideshows.
2. ReportLab: ReportLab is a Python library that allows you to create PDF documents with complex layouts and graphics. It provides a wide range of functionalities like creating tables, charts, and images. ReportLab is a great tool for generating reports with a professional look and feel.
3. PyPDF2: PyPDF2 is a Python library that allows you to manipulate PDF files. It provides a wide range of functionalities like merging PDF files, splitting PDF files, and encrypting PDF files. PyPDF2 is a great tool for generating reports that involve multiple PDF files.
4. Plotly: Plotly is a Python library that allows you to create interactive visualizations. It provides a wide range of functionalities like creating line charts, bar charts, and scatter plots. Plotly is a great tool for generating reports that involve interactive visualizations.
5. Dash: Dash is a Python framework for building analytical web applications. It allows you to create interactive dashboards that can be shared with others. Dash provides a wide range of functionalities like creating charts, tables, and maps. Dash is a great tool for generating reports that involve interactive dashboards.
In conclusion, Python provides several tools for generating reports, including Jupyter Notebook, ReportLab, PyPDF2, Plotly, and Dash. These tools provide a wide range of functionalities like creating PDF documents, manipulating PDF files, and creating interactive dashboards. By using these tools, you can generate informative and visually appealing reports that can be shared with others.
By following the techniques for gathering data, steps for analyzing data with Python, and tools for creating reports with Python, you can generate valuable insights from your data and present them in a visually appealing and informative
Final Thought: Benefits of Using Python for Data Analysis and Reporting
Python has become a popular choice for data analysis and reporting due to its versatility and vast library of packages. Here are some of the benefits of using Python for data analysis and reporting:
1. Easy to Learn: Python is easy to learn and has a simple syntax. It is an interpreted language, which means that you can run your code without having to compile it first. This makes it easy for beginners to start using Python for data analysis and reporting.
2. Vast Library of Packages: Python has a vast library of packages that cater to various data analysis needs. These packages provide a wide range of functionalities like data manipulation, data visualization, and statistical analysis. Some of the popular data analysis packages in Python include NumPy, Pandas, Matplotlib, and Seaborn.
3. Open-Source: Python is an open-source language, which means that it is free to use and distribute. This makes it accessible to everyone and encourages collaboration and innovation.
4. Integration with Other Tools and Platforms: Python can integrate with other tools and platforms, making it a popular choice for generating reports. For example, you can use Jupyter Notebook to create and share documents that contain live code, equations, visualizations, and narrative text.
5. Interactive Visualizations: Python’s data visualization packages like Matplotlib and Seaborn can be used to generate interactive and informative reports. Plotly is another Python library that allows you to create interactive visualizations, making your reports more engaging and informative.
6. Scalability: Python is a scalable language that can handle large datasets. It can be used for various types of data analysis, including exploratory data analysis, statistical analysis, and machine learning.
In conclusion, Python is a powerful tool for data analysis and reporting due to its versatility, vast library of packages, and integration with other tools and platforms. It is easy to learn, open-source, and scalable, making it accessible to everyone. By using Python for data analysis and reporting, you can generate valuable insights from your data and present them in a visually appealing and informative way.
